Statarea Predictions Today: Football Tips Explained
Every day, thousands of football punters across Africa and Europe search for one thing: reliable, data-driven predictions they can trust. Statarea has emerged as one of the most respected names in football statistics and match forecasting — powering betting decisions across hundreds of leagues worldwide.
But what exactly is Statarea? How does its prediction algorithm work? And — most importantly — how can you read, interpret, and apply its tips to genuinely improve your betting record?
This guide answers all of that. Whether you are checking Statarea for the first time or you have been following its tips for years, you will leave this page knowing exactly how to get the most from this powerful football prediction tool.
What Is Statarea? A Complete Overview
The History and Background of Statarea
Statarea is one of the world's most recognized football prediction and statistics platforms, originally operating under the name "Old Statarea." The platform built its reputation by offering mathematically derived football forecasts — completely free of charge — at a time when most prediction services required paid subscriptions.
What set Statarea apart from the beginning was a simple but powerful philosophy: predictions backed by numbers, not opinions. Unlike tipster-based services where anonymous "experts" offer gut-feel picks based on personal bias, Statarea uses quantitative mathematical models trained on years of historical football data to generate each forecast.
Today, Statarea covers over 700 leagues and tournaments across every continent, from the English Premier League and La Liga to regional African competitions and lower-division European leagues. Millions of users — from casual football fans to professional bettors — check the platform daily for their match tips.
Old Statarea vs. New Statarea — What Is the Difference?
Many punters still refer to "Old Statarea" — a label that stuck after the platform underwent a significant interface update and domain restructuring. The old.statarea.com version continues to exist alongside the main statarea.com site, and both versions remain active.
The core prediction algorithm and statistical model remain consistent across both domains. The newer statarea.com interface adds more detailed team pages, broader league coverage, improved navigation, and additional data features. However, the underlying prediction logic — the part that actually matters for betting decisions — operates on the same mathematical principles on both versions.
For practical purposes, both platforms deliver the same quality of statistical football predictions. Many prediction aggregators continue to reference the old format for its familiar, clean layout that experienced punters know well.
How Does Statarea Work? The Algorithm Explained
The Core Statistical Model
At the heart of every Statarea prediction is a mathematical probability model. For every match listed on the platform, the algorithm processes multiple data inputs and outputs a probability percentage for each of three possible outcomes:
- Home Win (1): The home team wins the match after 90 minutes.
- Draw (X): The match ends level at full time.
- Away Win (2): The visiting team wins the match.
The percentages for all three outcomes always sum to 100. The outcome carrying the highest probability becomes the platform's recommended prediction — also known as the Statarea 1X2 tip.
What Data Does Statarea Analyze?
Statarea's algorithm draws on a wide range of statistical inputs to build its probability model for each match:
- Recent form — The last 5–10 match results for each team, with recency weighting applied so that the most recent matches carry more influence than older results.
- Home and away records — Teams frequently perform very differently at home versus on the road. Statarea evaluates both records independently before combining them.
- Head-to-head history — Historical matchups between the two specific teams, including results, goal tallies, and long-term performance trends.
- Goals scored and conceded — Attack strength and defensive solidity metrics are factored into goal-market predictions like Over/Under and BTTS.
- League standings and position — Where each team sits in the table affects both motivation and relative quality.
- Bookmaker coefficients — Market odds serve as an additional external calibration point for the probability output.
What the Confidence Score Means
One of Statarea's most useful features is the confidence score shown alongside each prediction. This score — typically displayed as a percentage or a number out of 100 — reflects how strongly the algorithm backs a particular outcome.
A score close to 100 indicates that virtually every data factor aligns to support that prediction. A score around 50–60 signals a more evenly contested match where the algorithm has lower conviction.
As a practical rule, many experienced punters focus on tips with a Statarea confidence score of 70 or above, treating these as the platform's most reliable selections for any given matchday. Anything below 60 is generally treated with more caution and is often best avoided in high-stakes accumulators.
The Six Betting Markets Statarea Covers
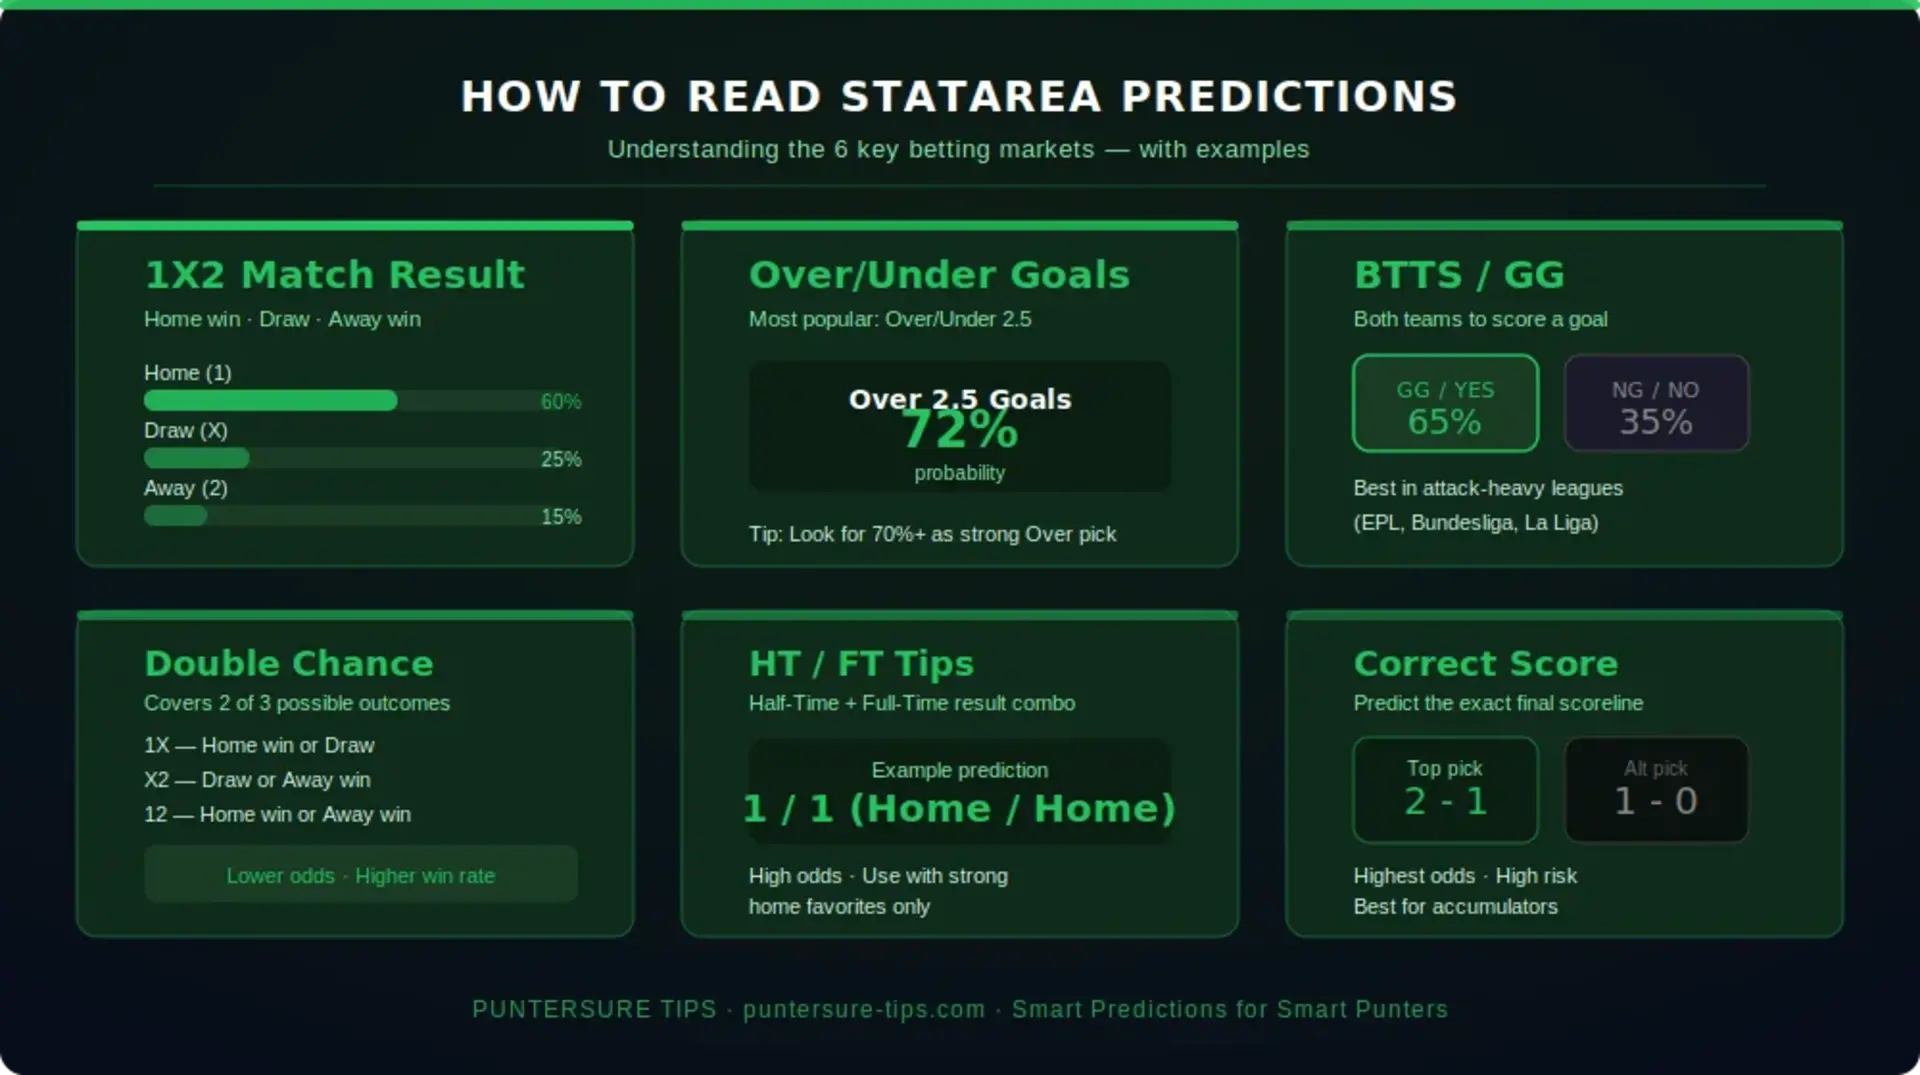
Statarea is far more than a simple win/draw/win predictor. It's great! The platform publishes daily tips across a wide range of football betting markets, each suited to different betting strategies and risk appetites.
1X2 — Match Result Predictions
The 1X2 market is Statarea's flagship — and by far its most popular — prediction type. It covers three possible outcomes: Home Win (1), Draw (X), or Away Win (2). These tips are published daily with percentage probabilities for each outcome, making them straightforward to read even for punters new to data-based betting.
The 1X2 market works best on matches where one team has a clear statistical advantage. When Statarea shows a Home Win probability of 75% or higher, that represents a strong algorithmic signal worth considering — particularly when combined with supporting context like good recent form and a weak away record for the visiting team.
Double Chance
Double Chance tips cover two outcomes combined into a single bet: Home or Draw (1X), Away or Draw (X2), or Home or Away (12). These are inherently safer bets with lower odds but a significantly higher probability of winning.
Double Chance is an excellent starting point for punters who want to use Statarea data but reduce exposure to single-outcome risk. The 12 option — Home or Away, eliminating the draw — is particularly popular in matches where both teams are attack-oriented and defensive errors are common.
Over/Under 2.5 Goals
Goal line predictions are one of Statarea's strongest markets. By analyzing both teams' attack strength, goals-per-game averages, and defensive records, the platform generates a probability for whether a match will feature more than 2.5 goals (Over) or fewer (Under).
Over 2.5 predictions are a staple of accumulators in leagues like the English Premier League, Bundesliga, and Dutch Eredivisie, where average goals per game are historically high. Under 2.5 tips, meanwhile, tend to perform well in low-scoring leagues like Italian Serie A or matches involving two defensively solid teams.
BTTS / GG — Both Teams to Score
The Both Teams to Score market (also written as BTTS or GG) predicts whether both teams will score at least one goal each. This market is independent of the match result — both teams can score in a game that ends 1–2 or 2–2 or any other scoreline where neither team keeps a clean sheet.
Statarea's goal-data analysis makes BTTS one of its more reliable markets, particularly in leagues and fixtures with high historical both-teams-to-score rates. Matches involving two teams with leaky defenses and active attackers are natural BTTS candidates. On the other hand, fixtures with a dominant defensive team and a poor attacking opponent are better candidates for the NG (No Goal) market.
HT/FT — Half-Time / Full-Time Predictions
HT/FT predictions combine the expected match result at half-time with the expected result at full time. For example, an HT/FT prediction of "Home / Home" means the algorithm expects the home team to lead at the break and still be ahead at the final whistle.
These tips carry significantly higher odds than standard 1X2 bets, reflecting the additional difficulty of predicting two results within a single match. They are best approached when a strong form indicator exists for both halves — such as a team that consistently leads at half-time and rarely concedes a comeback.
Correct Score Predictions
Correct Score tips predict the exact final scoreline. These are the hardest market to win in football betting but carry the highest potential returns. Statarea generates correct score probabilities through its goal-count models, identifying the most statistically likely scorelines based on both teams' scoring and conceding patterns.
Correct score bets should always be treated as high-risk, high-reward selections. Even on Statarea's most confident correct score tips, the probability rarely exceeds 25–30% for any single scoreline, reflecting the inherent unpredictability of exact goal counts.
Statarea Top 10 Predictions — The Daily Shortlist
Each day, Statarea publishes its Top 10 Predictions — the ten highest-confidence tips from the full list of matches across all leagues. This daily shortlist represents the algorithm's best opportunities: matches where the statistical signals align most strongly to favour a particular outcome.
For most punters, the Top 10 is the most practical starting point on any given day. Rather than sifting through hundreds of matches across obscure leagues, the Top 10 does the initial filtering automatically, surfacing the matches where Statarea's model has the highest conviction.
It is worth noting that the Top 10 still spans different leagues, different markets, and different confidence levels. Always read the probability percentages, not just the recommended outcome label, before adding a selection to your betting slip.
How to Use Statarea Predictions Effectively
Do Not Bet Every Match on the List
Statarea publishes predictions for hundreds of matches across dozens of leagues every single day. One of the most common and costly mistakes punters make is treating the full list like a ready-made betting slip. The platform is a data tool, not a guaranteed winner generator.
The smarter approach is to filter by confidence score and focus on the Top 10 or your own preferred leagues. Quality over quantity is the foundation of long-term profitable betting.
Cross-Reference with Other Sources
No single prediction platform — including Statarea — is infallible. The best strategy is to treat Statarea predictions as one layer of your analysis, then cross-reference with additional context: team news (injuries, suspensions, rotation), weather conditions, and match stakes (cup vs. league, relegation pressure, fixture congestion).
Platforms like Puntersure Tips add a further analytical layer on top of Statarea-style data by incorporating consistency scoring, AI-powered match simulations, and value detection — helping narrow the field to the strongest selections each day.
Build 2–3 Match Accumulators, Not 10+
Many punters are drawn to building large accumulators by stacking Statarea picks because the combined odds look attractive on paper. However, each additional selection multiplies the risk exponentially. A disciplined 2–3 match accumulator using tips with 70%+ confidence will deliver more consistent returns over time than a 10-game parlay.
Even the best prediction algorithms cannot overcome the mathematical reality that a 10-fold accumulator requires ten correct outcomes. A single unexpected red card, injury, or goalkeeping error can unravel the entire slip — regardless of how strong the individual predictions looked.
Track Your Results Over Time
One of the most underused features on Statarea is its historical results archive, which shows how past predictions performed. Before committing to any particular market or confidence threshold, spend time reviewing how the platform has performed on similar tips in recent months.
This creates a data-driven baseline for your own expectations and helps identify which markets and leagues Statarea has historically been most accurate on — information that is far more useful than any single day's prediction.
How Statarea Compares to Other Prediction Sites
The football prediction landscape is crowded, but Statarea consistently earns its reputation as a trusted benchmark. Here is how it compares to some of its closest alternatives.
Statarea vs. Forebet
Forebet uses a similar mathematical approach but tends to display more granular statistical tables and a wider range of raw data points per match. Statarea's interface is cleaner and more navigation-friendly, making it more accessible for casual punters who want quick picks rather than deep data analysis.
Statarea vs. SoccerVista
SoccerVista mixes tipster-generated picks with statistical data, meaning human bias can influence some selections. Statarea is purely algorithmic, which removes personal bias from the equation — though it also means it cannot account for non-statistical factors like squad morale or a new manager effect.
Statarea vs. Vitibet
Vitibet also uses a probability-based model but focuses more heavily on bookmaker odds as inputs. Statarea derives its probabilities more directly from match data and team statistics, making its outputs more insulated from bookmaker pricing distortions.
Statarea vs. Puntersure Tips
Puntersure Tips builds on the same statistical foundation as Statarea but applies a secondary layer of AI-powered match simulations, a proprietary Consistency Score for each prediction, and curated coverage of Kenyan Premier League and other African leagues not always prioritized on Statarea's global platform.
Where Statarea provides raw probability outputs, Puntersure Tips translates those probabilities into ranked, filtered daily tips with explicit confidence ratings and value flags — saving time and reducing decision fatigue for punters across Kenya and East Africa.
Tips for First-Time Statarea Users
Start with the Top 10 Daily Predictions
If this is your first time using Statarea, always begin with the daily Top 10 list. These represent the algorithm's most confident picks of the day and serve as the best entry point for understanding how the scoring system works. Once you are comfortable reading the probabilities and confidence scores on Top 10 matches, you can begin exploring the full fixture list for additional opportunities.
Read the Percentages, Not Just the Label
This is the single most important habit to develop on Statarea. A prediction where Home Win reads 52% is a fundamentally different betting proposition from one where Home Win reads 85%. The label says "Home Win" in both cases, but the probability tells an entirely different story. Always read the numbers — they are the actual prediction; the outcome label is just a summary.
Check Head-to-Head Records Before Confirming a Bet
The H2H section on every Statarea match page contains historical context that can significantly strengthen or weaken the algorithmic output. Some fixtures have clear, long-running patterns — certain teams consistently dominate their local rivals regardless of current league form. This historical edge is valuable data that should inform, not override, the statistical probability.
Respect Bankroll Management Above All Else
No prediction platform — however well-designed — can eliminate the inherent uncertainty of football. Smart, sustainable punters allocate fixed stakes per bet: typically 1–5% of their total bankroll per selection. This structure absorbs the inevitable losing streaks without wiping out the betting fund, allowing the long-term edge from quality predictions to compound over time.
Responsible betting means never staking money you cannot afford to lose, and always treating prediction tips — including Statarea's — as informed guidance rather than guaranteed outcomes.
Final Verdict: Is Statarea Worth Using?
Yes — emphatically. Statarea is one of the most reliable free football prediction tools available anywhere online. Its algorithmic approach removes personal bias, its coverage across 700+ leagues is unmatched among free platforms, and the daily Top 10 list provides an immediately actionable shortlist of the strongest statistical opportunities.
However, Statarea works best as part of a broader research toolkit rather than as a sole decision-maker. Combining its statistical probabilities with team news, live odds movements, and additional analytical layers — such as those provided by Puntersure Tips — gives you the most complete picture before committing to a bet.
If you want daily football predictions backed by data-driven analysis, Puntersure Tips delivers Statarea-style statistical rigor alongside AI-powered simulations, Kenyan league expertise, and free daily tips via Telegram. All designed to help African punters bet smarter, not harder.
The content on this page is for informational purposes only. Football betting involves risk. Please gamble responsibly and only stake what you can afford to lose.
Sources & References
Predictions are for informational and entertainment purposes only, not betting advice. See our editorial policy for how content is sourced, reviewed, and corrected. 18+ · Play responsibly.